Originally published on Twitter and Linkedin on 01/05/2023
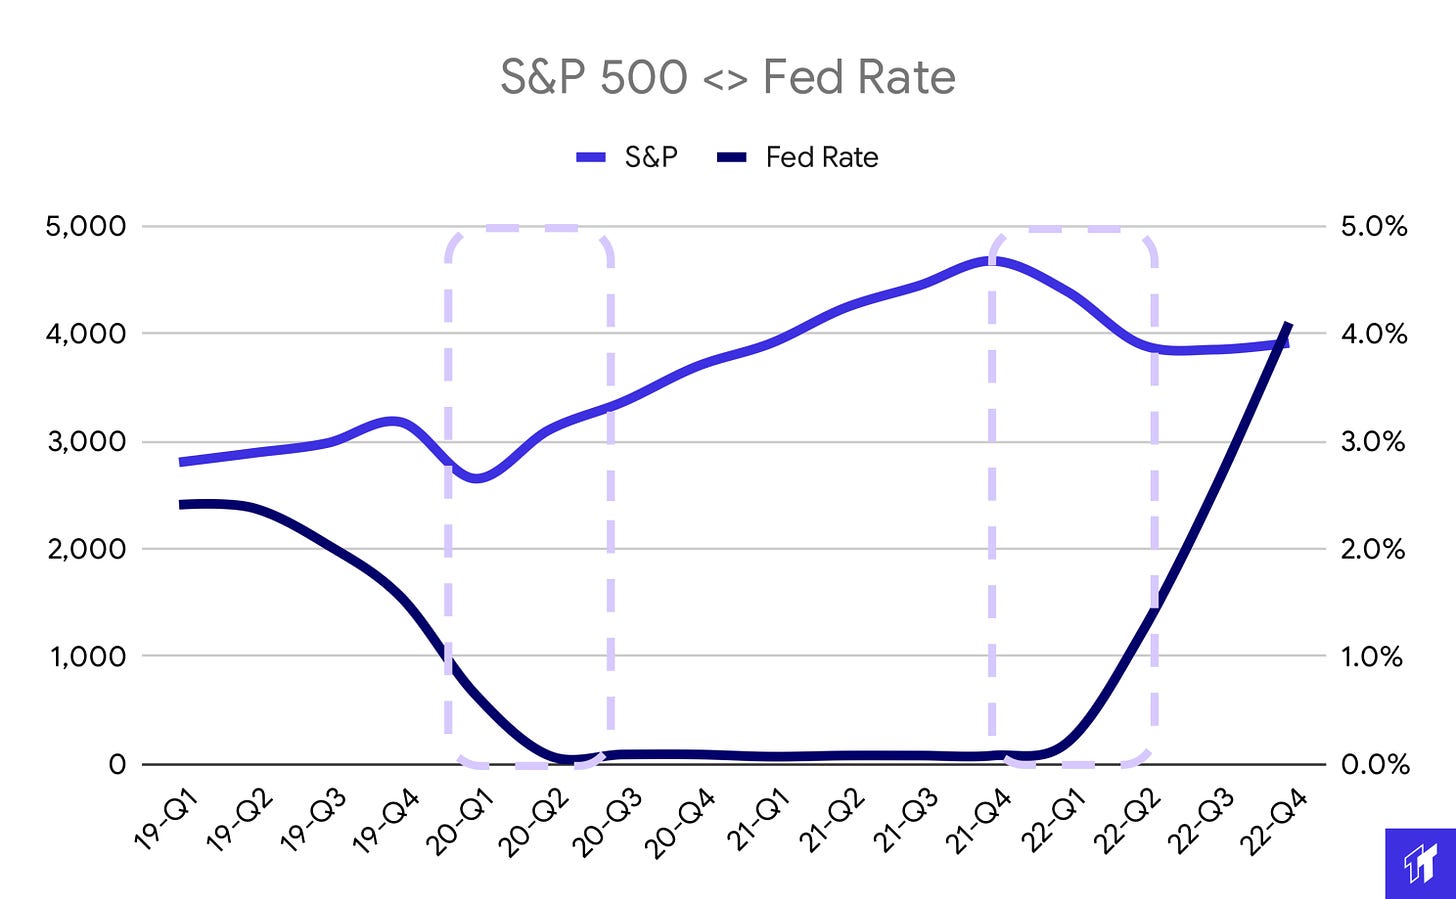
We know about Fed rates and CPI. But there’s more to it! Tech shocked the market twice: with a flash in the pan, then a leaky bucket. Both shocks magnified the tech cycle. Stock forecasts & earnings tell the story:
1/ Quick refresh on the Fed: When rates are low, asset multiples are high (bc there’s a low opportunity cost for the capital). When rates are high, the inverse is true: asset values decline (bc you can make “risk-free” Uncle Sam $)
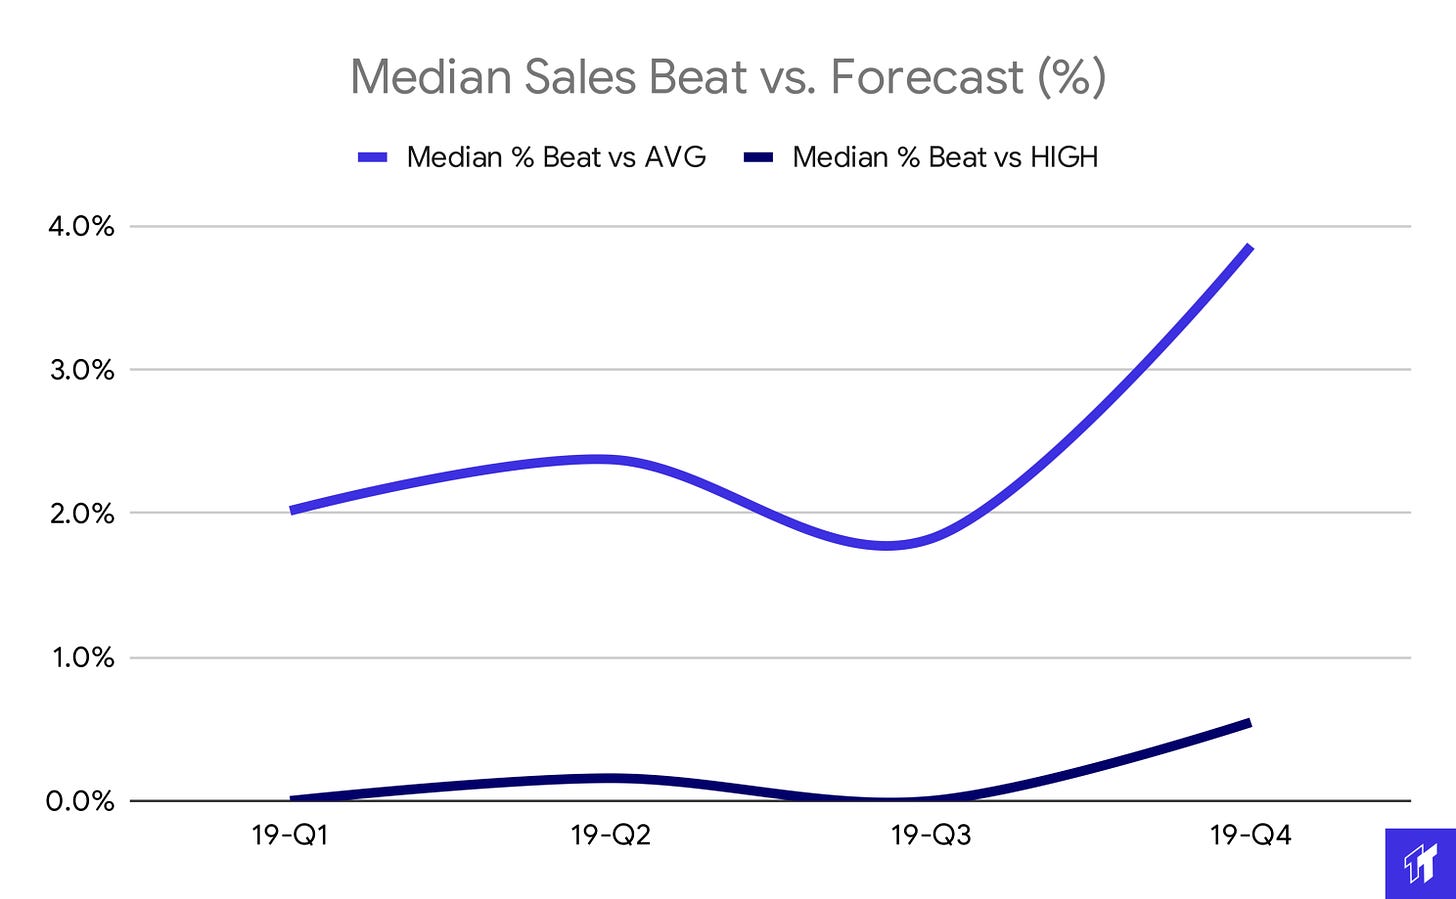
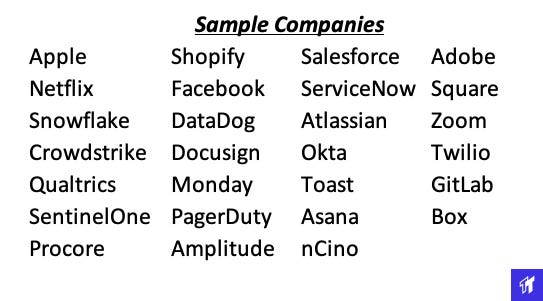
2/ But there’s more to it! And in tech + vc specifically. We took a basket of 27 well-covered technology stocks (20 analyst avg) and plotted actual performance vs. [A] the Average analyst’s forecast and [B] the Highest (most bullish) single analyst’s forecast.
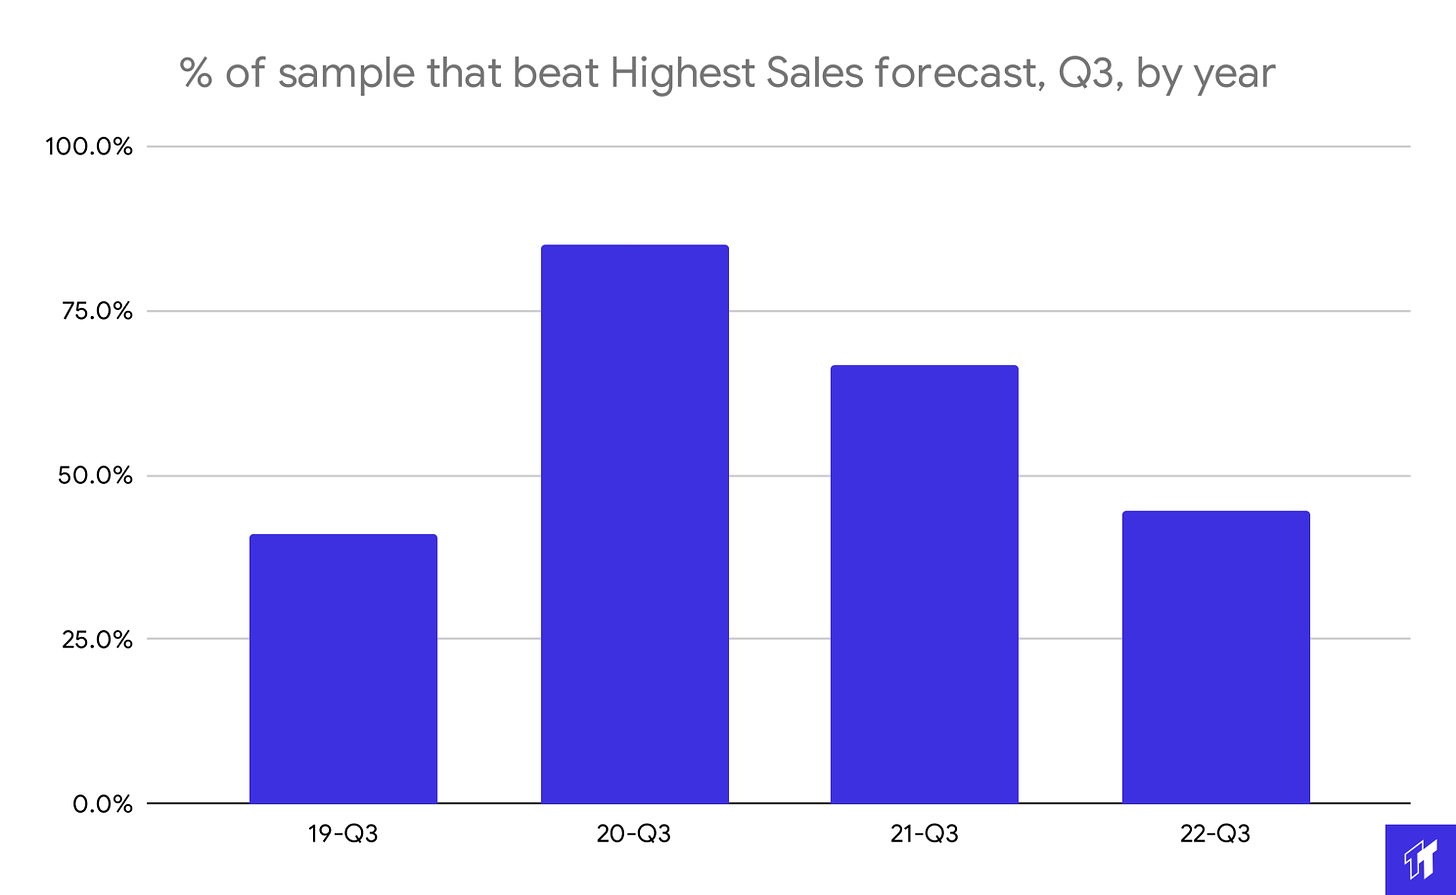
3/ Back in 2019, things were relatively sane. Tech was performing in line with forecasts:
4/ Note how little area is under the darker line (% sales above highest forecast). So, as a public investor, if you had built your upside model on the most bullish analyst’s forecast, you’d feel good – even conservative!
5/ Similarly, vc’s use peer-group growth rates <> revenue scale to underwrite venture and growth rounds. Forecast accuracy & consistency underscored how tech had matured: the world had a grasp on this asset class
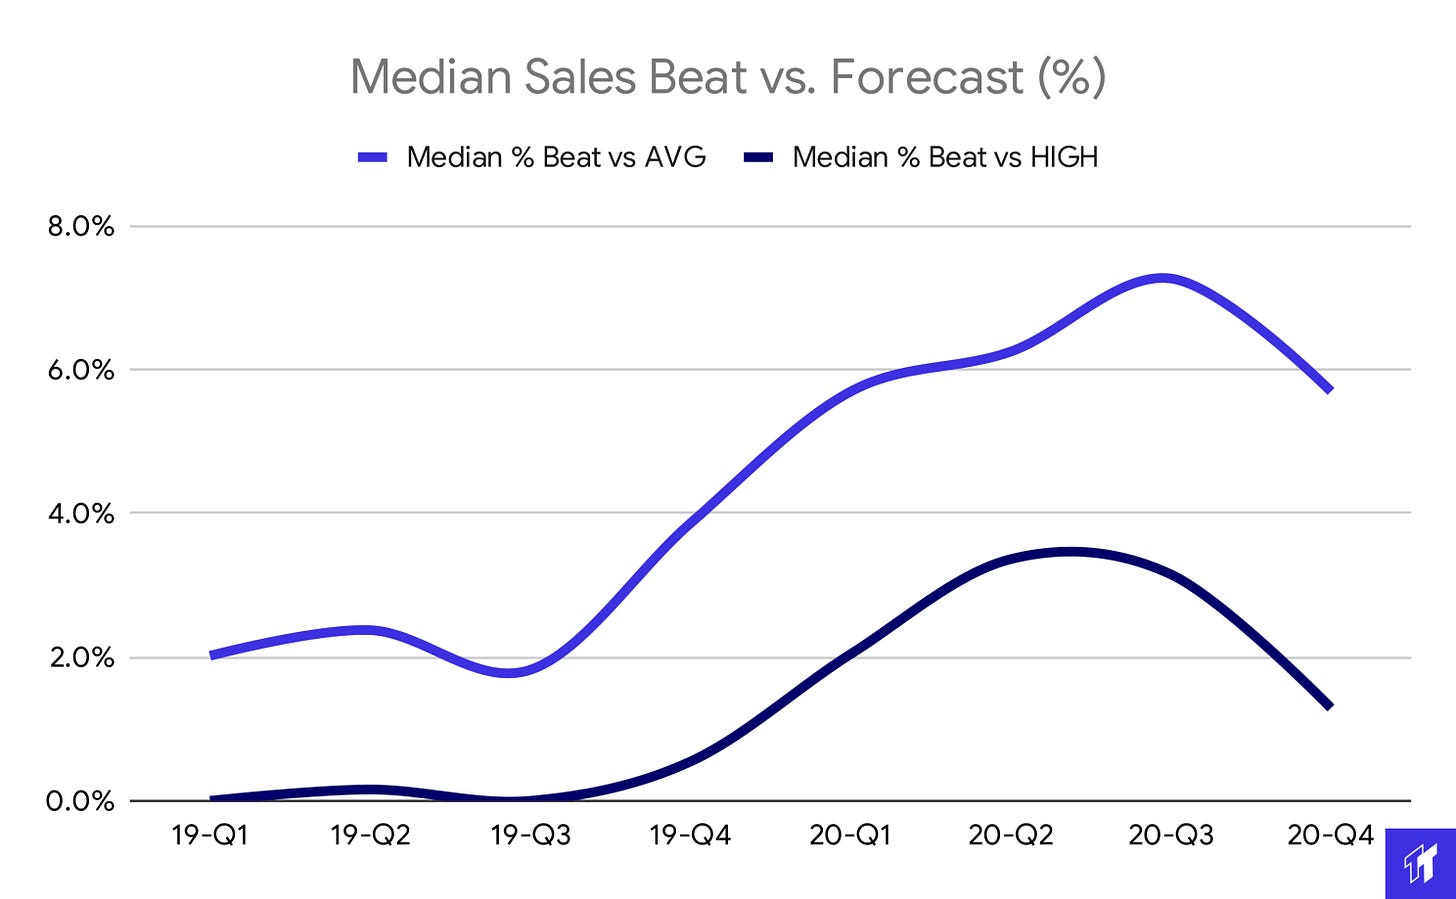
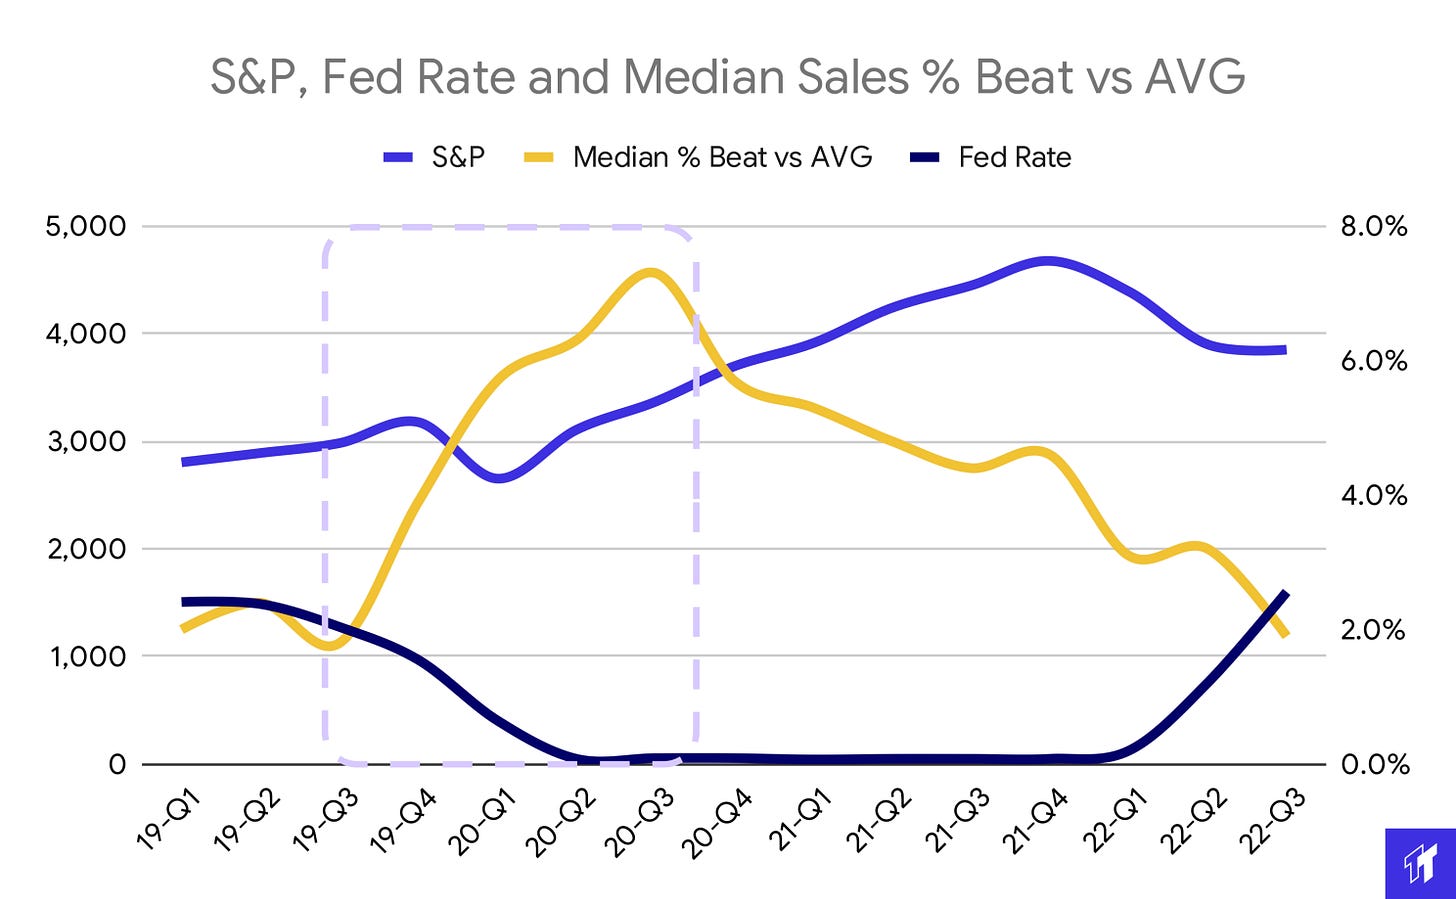
6/ Then came 2020 and COVID-19. Many thought the market would crater. Instead, tech blew the doors off top-line forecasts. Shock #1: The Flash in the Pan...
7/ Median Sales beat % climbed 2x+ YoY against average and high beats in 2021. Look at the area under the dark curve in 2020, compared to 2019. These are massive, climbing beats:
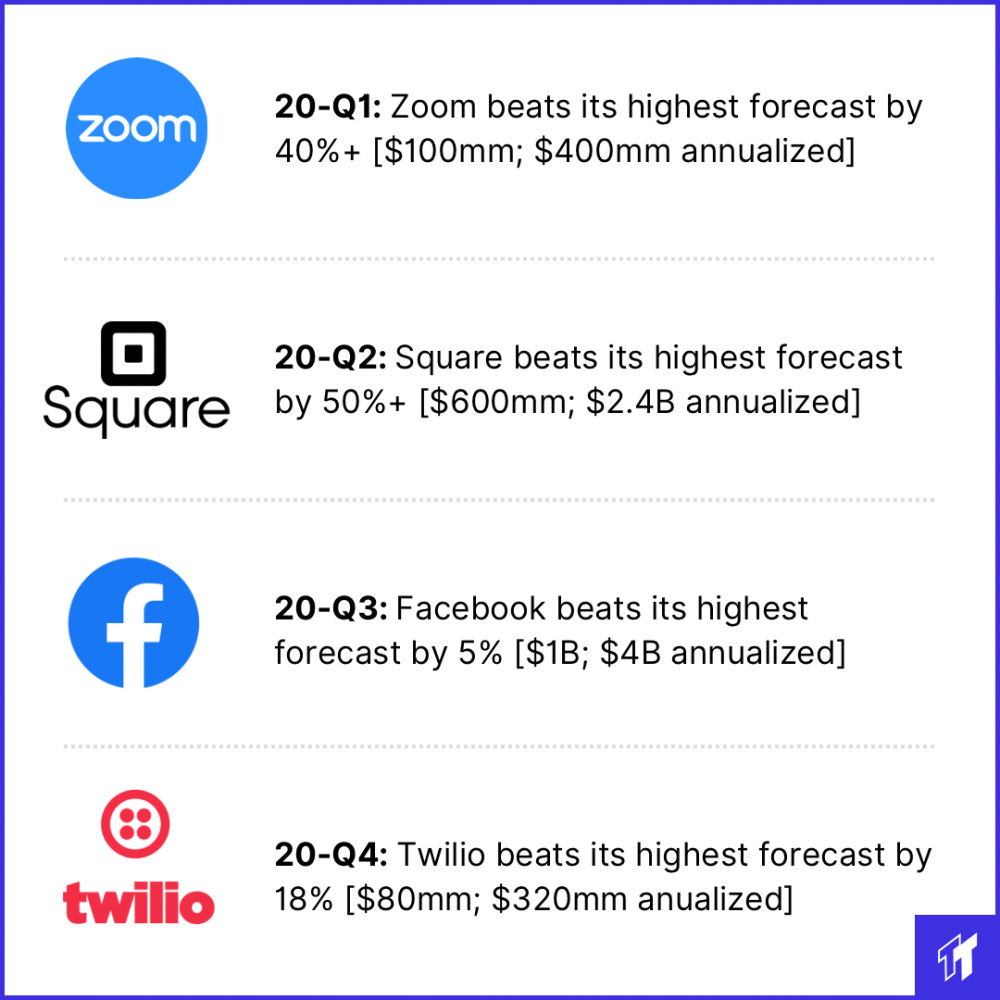
8/ Investor psychology and growth models changed overnight – and valuations ballooned. Some of the big beats behind the chart:
9/ Assets have effectively three valuation drivers: 1] Growth; 2] Risk; 3] Cash flows
When any are revised, the output moves meaningfully...
10/ In 2020, two drivers moved meaningfully, together, for the bulls:
1) Growth: tech’s market-shocking-beats; 2) Risk: Fed cut rates
11/ We know now this growth was not persistent or indicative of market depth: it was largely a Flash in the Pan. The result of lockdowns & cheap, plentiful capital.
By 22-Q3, the % of our sample beating their highest forecasts was returning to 19-Q3 levels:
12/ But there was another shock to follow: The Leaky Bucket. Let’s talk about the third driver of asset valuation: cash flows.
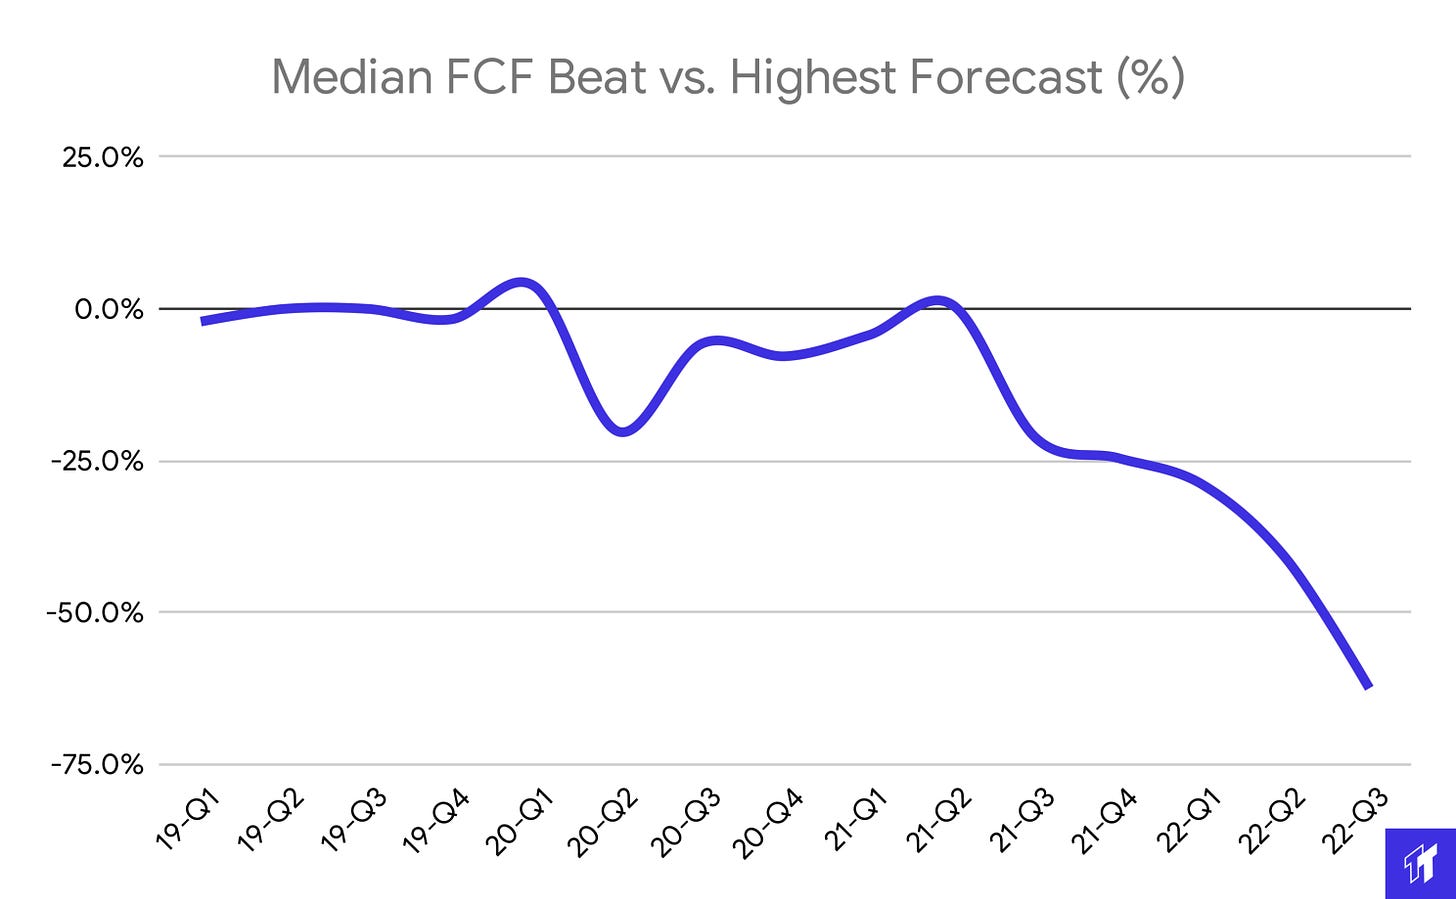
Tech was long hailed for its business model quality. But, beginning 21-H1, beats softened, and misses mounted...
13/ Shock #2 The Leaky Bucket. In 2019, the Median % Beat vs. FCF (high) forecast was -1% for the sample. In 2022 the figure was -45%
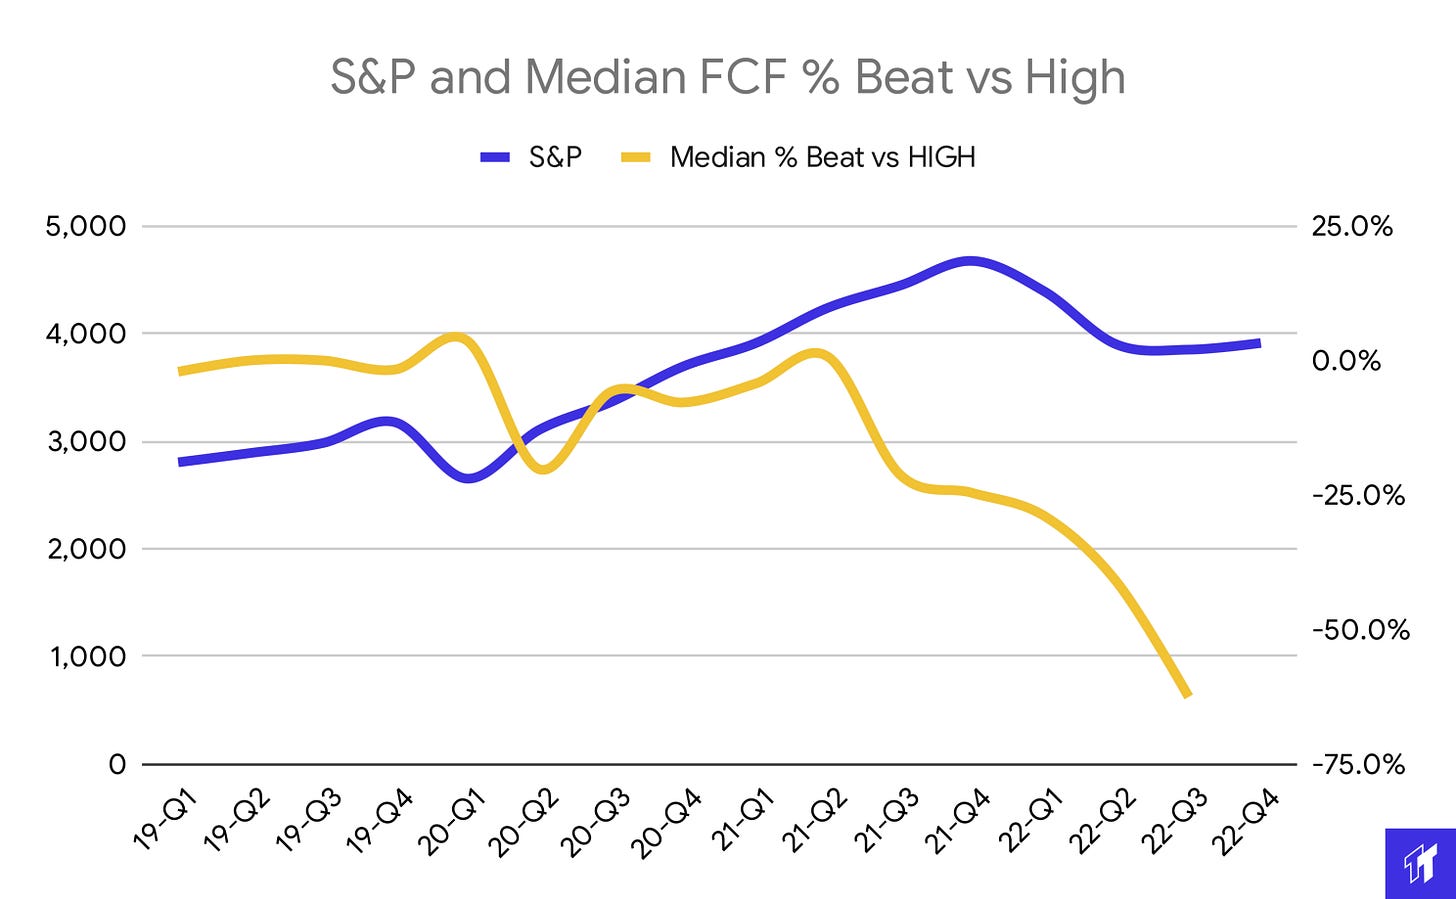
14/ This shock largely played out in 21-H2, coinciding with high CPI prints, and an anticipation of Fed rate hikes. Once again, 2/3 valuation drivers changed models dramatically: Risk and Cash Flows.
This time it was for the bears -- the S&P declined ~20% in 22-H1:
15/ And now it’s a brave new year! That's it for TT01: Beyond the Fed
Prediction for 23-Q1:
- Sales beat high forecasts by 2% (median)
- FCF miss high forecasts by 25% (median)
- S&P exits Q1 at 3,500
16/ For reference -- the 27 sample companies
17/ Other thoughts:
- Forecast <> beat trends interest me re: the psychology of the market
- Analysts sandbag. Suspect this is due to an incentive for access to management. The focus of this thread is on the trend, not the quantum
18/ Massive thanks to Tyler Galpin, Ben Kany, and Sid Vashist for the lift here.
Follow @ThursdayThreads on twitter for more posts, every Thursday!


